Preliminary results - election 2021
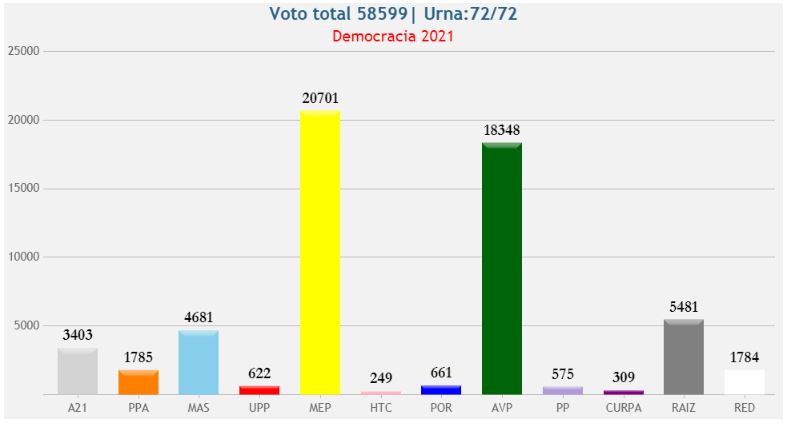
Total votes per political party

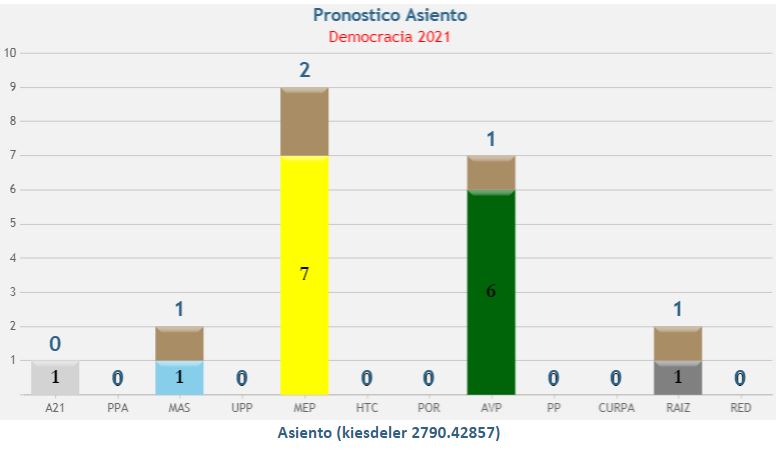
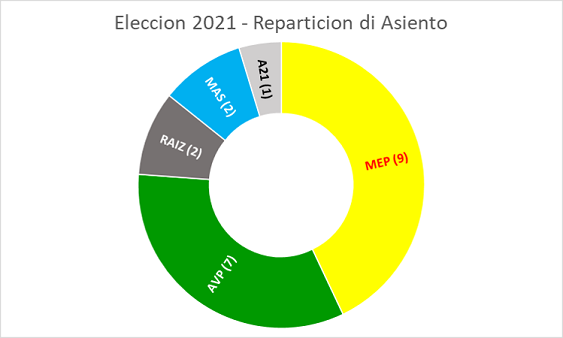
Seat distribution

The seats in Parliament were initially allocated to the following candidates.
| Elections 2021- Seat distribution | |||
|---|---|---|---|
Electoral quotient: 2.792 | |||
|
Candidate |
Political Party |
No. of seats |
Votes |
| 1. Evelyn Wever-Croes |
 | 1 |
7.518 |
| 1. Mike Eman |
 | 1 |
6.668 |
|
1. Marisol Lopez-Tromp |
| 1 |
4.191 |
(Electoral quotient/2)+1 = (2.792/2)+1 = 1.397 | |||
|
3 Dangui Oduber |
 |
2 |
2.060 |
|
1. Miguel Mansur |
 |
1 |
2.019 |
|
1. Ursell Arends |
 |
1 |
1.939 |
|
4. Glenbert Croes |
 |
3 |
1.929 |
|
4. Gerlien Croes |
 |
2 |
1.919 |
|
2. Xiomara Ruiz-Maduro |
 |
4 |
1.883 |
|
29. Benny Sevinger |
 |
3 |
1.614 |
|
2. Geoffrey Wever |
 |
2 |
1.430 |
|
2. Mike de Meza |
 |
4 |
1.410 |
Sequence candidates list | |||
|
2. Aquanette Gunn |
|
2 |
77 |
|
5. Rocco Tjon |
 |
5 |
908 |
|
6. Arthur Vallejo |
 |
6 |
528 |
|
7. Hendrik Tevreden |
 |
7 |
670 |
|
8. Endy Croes |
 |
8 |
1.006 |
|
9. Edgar Vrolijk |
 |
9 |
619 |
|
3. Arthur Dowers |
 |
5 |
1.177 |
|
5. R. Santos do Nascimento |
 |
6 |
214 |
|
6.Wyatt-Ras Melvin |
 |
7 |
580 |

Election results individual votes
Below you can find out the number of votes per polling station and the votes cast (individual votes) per polling station.
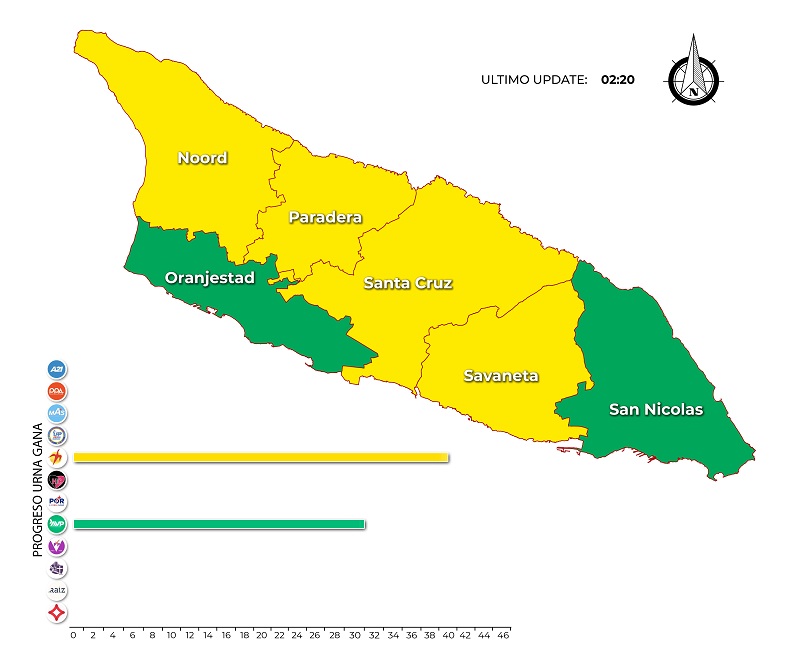
Electoral Map

Vote getter Parliamentary elections 1985-2021
The following is a list of the individuals who have received the most popular votes for the Aruba Parliamentary elections over the period 1985-2017.
| Election | # Voters | # Votes cast | # Valid votes | # Invalid votes | # Non voters | Vote getter | Political party | # Votes | % Voters | % Votes cast | % Valid votes |
|---|---|---|---|---|---|---|---|---|---|---|---|
| 1985 | 43.393 | 37.033 | 36.642 | 391 | 6.360 |
Betico Croes |
| 8.879 | 20,46 | 23,98 | 24,23 |
| 1989 | 43.054 | 36.465 | 36.032 | 433 | 6.589 |
Henny Eman |
| 5.107 | 11,86 | 14,01 | 14,17 |
| 1993 | 45.680 | 40.240 | 39.867 | 373 | 5.440 |
Henny Eman |
| 6.230 | 13,64 | 15,48 | 15,63 |
| 1994 | 46.848 | 39.986 | 39.566 | 420 | 6.862 |
Henny Eman |
| 5.737 | 12,25 | 14,35 | 14,50 |
| 1997 | 52.752 | 45.327 | 44.741 | 586 | 7.425 |
Henny Eman |
| 5.053 | 9,58 | 11,15 | 11,29 |
| 2001 | 56.617 | 48.565 | 47.969 | 596 | 8.052 |
Nel Oduber |
| 4.891 | 8,64 | 10,07 | 10,20 |
| 2005 | 60.635 | 51.990 | 51.317 | 673 | 8.645 |
Mike Eman |
| 6.188 | 10,21 | 11,90 | 12,06 |
| 2009 | 64.602 | 55.750 | 55.121 | 629 | 8.852 |
Mike Eman |
| 8.068 | 12,49 | 14,47 | 14,64 |
| 2013 | 68.758 | 58.350 | 57.794 | 556 | 10.408 |
Mike Eman |
| 8.222 | 11,96 | 14,09 | 14,23 |
| 2017 | 70.750 | 59.430 | 58.679 | 751 | 11.320 |
Mike Eman |
| 7.822 | 11,06 | 13,16 | 13,33 |
| 2021 | 70.281 | 59.536 | 58.646 | 890 | 10.745 |
Evelyn Wever-Croes |
| 7.518 | 10.70 | 12.63 | 12.62 |
Presentation election night
Below you will find the preliminary election results as presented on the homepage of this site on election night.


