Election 2017 - Preliminary results
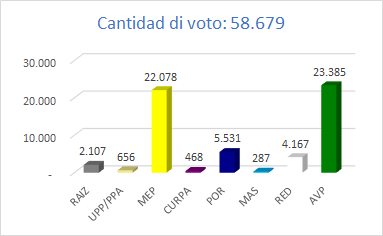
Total votes per political party

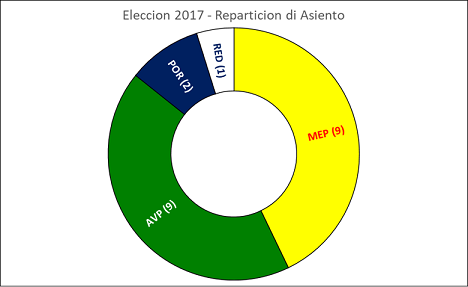
Seat distribution

The seats in Parliament.were initially allocated to the following candidates.
| Elections 2017 - Seat distribution | |||
|---|---|---|---|
Electoral quotient: 2.792 | |||
|
Candidate |
Political party |
No. of seats |
Votes |
|
1. Mike Eman |
|
1 |
7.822 |
| 1. Evelyn Wever-Croes |
| 1 | 3.503 |
|
1. Ricardo Croes |
 |
1 |
3.359 |
(Electoral quotient/2)+1 = (2.792/2)+1 = 1.397 | |||
|
2. Benny Sevinger |
| 2 |
2.785 |
|
2. Xiomara Ruiz-Maduro |
|
2 |
2.696 |
|
5. Glenbert Croes |
|
3 |
2.491 |
|
4. Dangui Oduber |
|
4 |
2.399 |
|
3. Mike de Meza |
|
3 |
2.028 |
|
1. Otmar Oduber |
|
1 |
1.808 |
| Arthur Dowers |
|
4 |
1.505 |
Sequence candidates list | |||
|
3. Chris Romero |
|
5 |
1.048 |
|
6. Guilfred Besaril |
|
7 |
508 |
|
7. Hendrik Tevreden |
|
7 |
792 |
|
8. Rocco Tjon |
|
8 |
1.213 |
|
9. Daphne Lejuez |
|
9 |
196 |
|
2. Andin Bikker |
|
2 |
1.086 |
|
5. Richard Arends |
|
5 |
1.390 |
|
6. Melvin Wyatt-Ras |
|
6 |
661 |
|
7. Robert Candelaria |
|
7 |
344 |
| 8. Carlos Schwengle |
|
8 |
467 |
|
9. Richard Visser |
|
9 |
175 |

Election results individual votes
Below you can find out the number of votes per polling station and the votes cast (individual votes) per polling station.
Vote getter Parliamentary elections 1985-2017
The following is a list of the individuals who have received the most popular votes for the Aruba Parliamentary elections over the period 1985-2017.
| Election | # Voters | # Votes cast | # Valid votes | # Invalid votes | # Non-voters | Vote getter | Political party | # Votes | % Voters | % Votes cast | % Valid votes |
|---|---|---|---|---|---|---|---|---|---|---|---|
| 1985 | 43.393 | 37.033 | 36.642 | 391 | 6.360 |
Betico Croes |
| 8.879 | 20,46 | 23,98 | 24,23 |
| 1989 | 43.054 | 36.465 | 36.032 | 433 | 6.589 |
Henny Eman |
| 5.107 | 11,86 | 14,01 | 14,17 |
| 1993 | 45.680 | 40.240 | 39.867 | 373 | 5.440 |
Henny Eman |
| 6.230 | 13,64 | 15,48 | 15,63 |
| 1994 | 46.848 | 39.986 | 39.566 | 420 | 6.862 |
Henny Eman |
| 5.737 | 12,25 | 14,35 | 14,50 |
| 1997 | 52.752 | 45.327 | 44.741 | 586 | 7.425 |
Henny Eman |
| 5.053 | 9,58 | 11,15 | 11,29 |
| 2001 | 56.617 | 48.565 | 47.969 | 596 | 8.052 |
Nel Oduber |
| 4.891 | 8,64 | 10,07 | 10,20 |
| 2005 | 60.635 | 51.990 | 51.317 | 673 | 8.645 |
Mike Eman |
| 6.188 | 10,21 | 11,90 | 12,06 |
| 2009 | 64.602 | 55.750 | 55.121 | 629 | 8.852 |
Mike Eman |
| 8.068 | 12,49 | 14,47 | 14,64 |
| 2013 | 68.758 | 58.350 | 57.794 | 556 | 10.408 |
Mike Eman |
| 8.222 | 11,96 | 14,09 | 14,23 |
| 2017 | 70.750 | 59.430 | 58.679 | 751 | 11.320 |
Mike Eman |
| 7.822 | 11,06 | 13,16 | 13,33 |
| 2021 |
? |
Presentation election night
Below you will find the preliminary election results as presented on the homepage of this site on election night.
